Virtual Coach: System Implementation
The Virtual Coach is a software engine that can run interactive situational simulations of construction projects, using a framework that I have independently developed. The simulation can keep track of labor and material usage and future requiremnts on the project and update the project schedule and as-planned versus as-built statistics of cost and material installation to reflect the most recent decisions taken by the project participants. Using information in a knowledge base about the project at hand, the simulation can generate realistic events like labor strikes, bad weather periods, and space constraints to create challenging management scenarios. Such scenarios can be used for trainning construction managers explore "what-if" scenarios. The software can also be used as a real time decision making tool.
The Virtual Coach system was implemented using a multi-agent framework that I proposed. Different aspects of the simulation environment are encoded into a set of variables which can take up discrete values or continuous values depending on the nature of the aspect it defines. The framework consists of a set of agents each of which have access to a finite and exclusive set of operations that it can commit on different subsets of the environment variables. The agents are inferencing programs. They predict future events in the simulation, and update and maintain consistency in the simulation environment in response to participant interactions. The agent operations are defined in interfaces that an agent class needs to implement. An agent's access to operations depends on the particular set of operations that are defined in the interface that it implements. The framework also consists of a set of utility functions that can be called by all agents. Such utility functions allow the agents to reschedule the project or calculate the remaining duration of a particular activity or the whole project, as and when necessary.
The system was implemented in Sun Java. It has a client-server relationship with a PostgreSQL database that contains information about the project that is being simulated. The emulation engine reads the "As-Planned" cost and schedule information and the various event parameters (event densities, event probabilities, event durations) from the database server during the pre-simulation phase. This information provides the user with an understanding of the project before the simulation starts (Fig.1). As the simulation proceeds the emulation engine documents all user decisions (what decisions they take within the environment) and user interactions (time stamped record of mouse clicks) within the system. This information also gets written to the database server as the simulation proceeds and can be used later for data mining pusposes.
The system runs two main parallel threads. The main thread steps the simulation through each day/week of the simulation and carries out all the relevant calculations and logical inferences about the simulated project. The second thread runs the visualization engine. The two threads are dependent on each other. Information processed in the main thread dispatches a message to the visualization thread triggering it to update its information panels. Once the information panels have been updated and the user has completed input, the visualization thread passes back control to the main thread, which then proceeds to update the environment to reflect the user's decisions. After the simulation thread has passed on control to the visualization thread, the user has the choice to scan through the information available and make an informed decision. The time taken to do this can either be constrained by the system or the user has the choice to take as much time as he/she wants, and then hit the "Continue Simulation" button to indicate that the visualization thread can pass back control to the main thread.
The main thread of the emulation maintains temporal and logical consistency of variables in the simulation and keeps it updated to accurately reflect the users interactions. The entire simulation environment is coded in terms of discrete and continuous variables, which define specific aspects of the environment. An example of a discrete variable is weather, which can take discrete values of "Sunny", "Snowy" and "Rainy". Cost and productivity variables are represented as continuous variables and can take up values from the set of real numbers. The main thread of the emulation engine infers possible future events based on the current situation within the simulation environment (Mukherjee & Rojas, 2003) and then generates the probabilities of such events occurring based on previous occurrences and other conditional dependencies (for example if the participant indulges in overwork too often it increases the probabilities of re-work). The inferred events are scheduled and future values of the environment variables are updated to reflect the effects of current events. The main thread also calculates the remaining duration of and work remaining on each activity in the simulated project at the end of each daygweek. It also updates project records of direct and indirect costs of the simulated project. This information is periodically passed onto the visualization thread, which in turn updates the visual interface. Finally, the main thread writes time stamped information to the database for future data mining purposes.
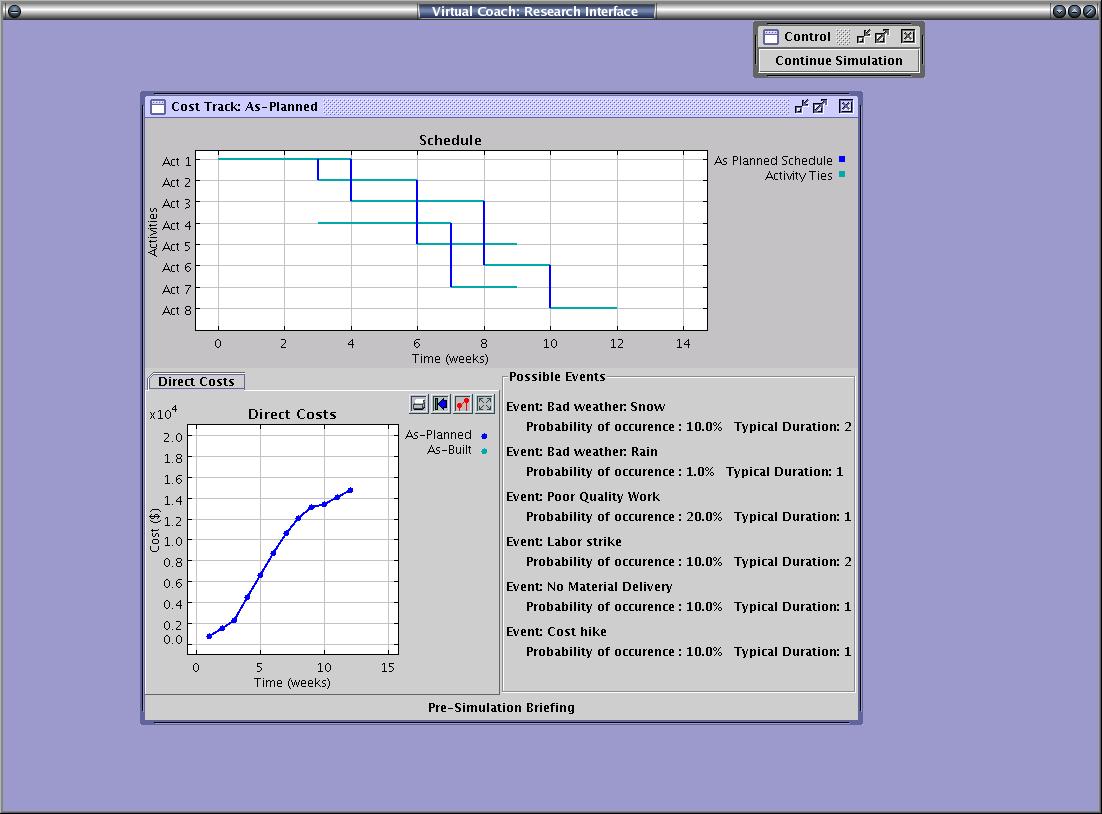
Appropriate information visualization and user interactivity are critical to the success of the emulation engine. Figures 1, 2, 3 and 4 provide screenshots of a preliminary deployment of the system. Figure 1, is the pre-simulation briefing screen, and it informs the participant of the particulars of the simulation environment immediately before the simulation starts off.
Fig. 1: Pre-Simulation Briefing
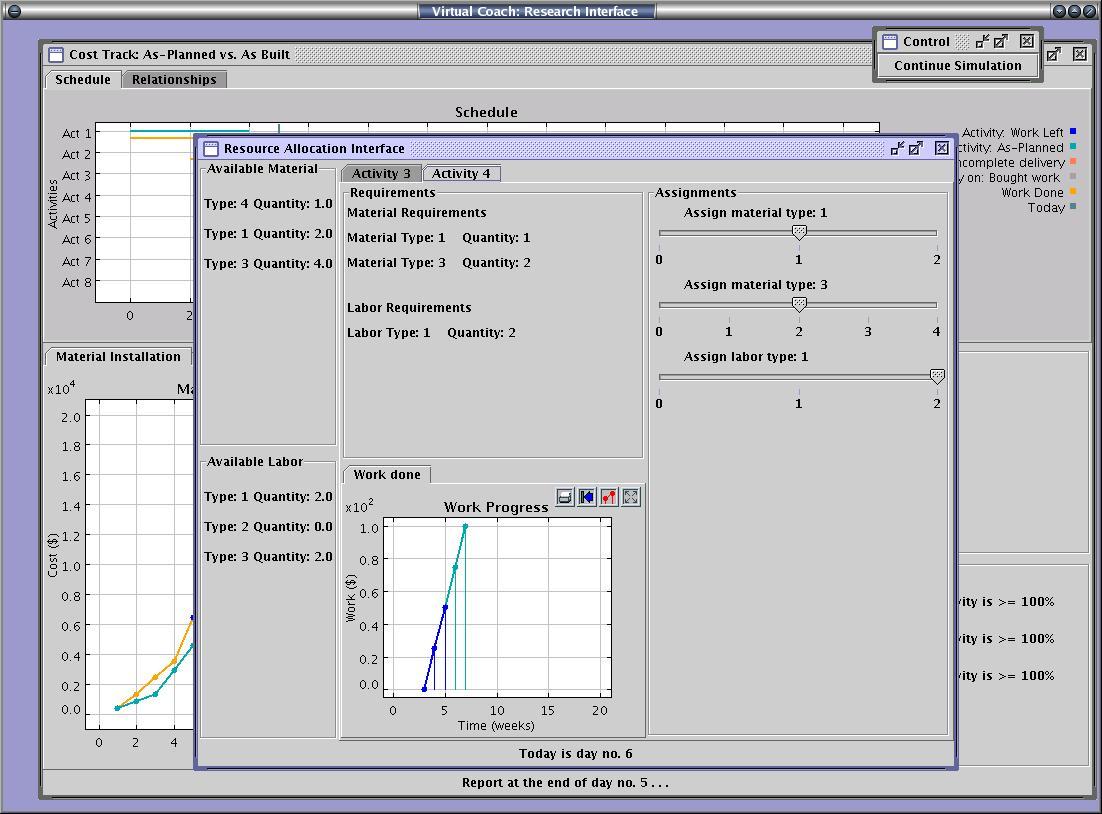
Figure 2, is the resource allocation screen, which informs the participant of the total available resources in the environment and the total resource requirements specific to each ongoing activity in the simulation. Each activity panel also has a graph showing the "As-Planned" rate of work completion versus the "As-Built" rate of work completion. The participant is allowed to assign more or less than the planned requirements depending on availability to accelerate or decelerate the project.
Fig. 2: Resource Allocation Interface
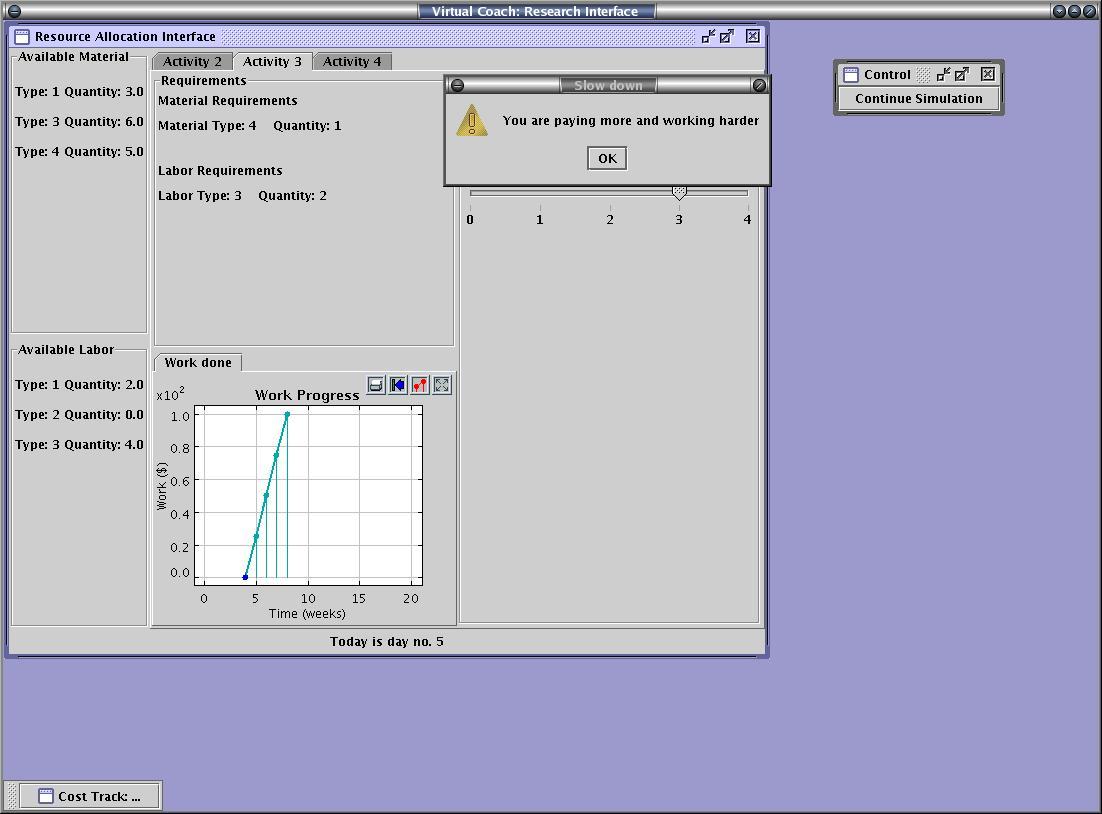
In the absence of the necessary resources, the participant is also allowed to hire more labor and purchase more material at a premium price (Fig. 3). This allows the participant to accelerate the project, at a higher cost, and is often an option to keep the project on schedule. While the direct costs go up, the participant does gain terms of indirect costs by saving time.
Fig. 3: Participant Purchasing Resources
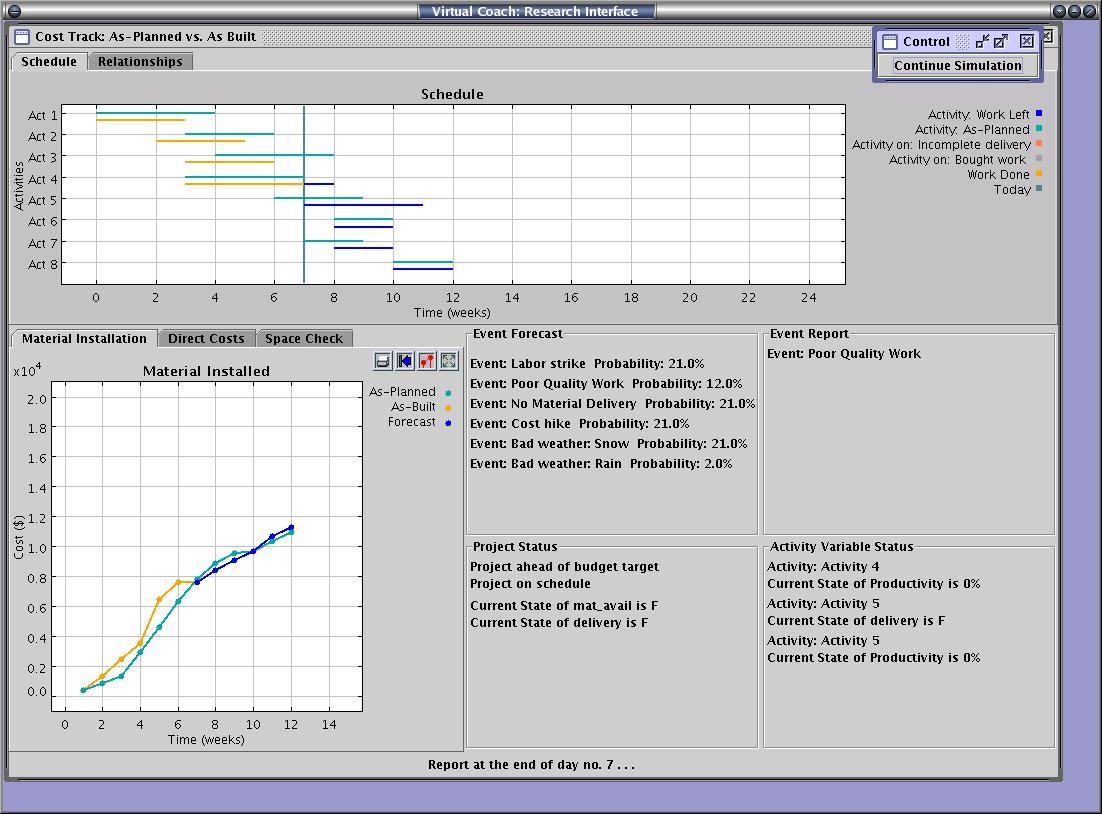
Finally, figure 4., illustrates the day report about progress at the end of a daygweek. The participant can view the current state of the schedule compared to the "As-Planned" schedules. He/she can also keep track of direct costs, indirect costs and space requirements by following the graphics at the lower left hand corner of the viewer. The lower right hand corner of the viewer allows the participant to monitor the values of discrete and continuous environment variables and keep track of the possibilities of events that may occur in the near future. They can also keep track of recent events that have just occurred. This is important in allowing them to make future resource allocations.
Fig. 4: End-of-day Report